


By SRSrocco Report
The U.S. Shale Energy Industry is heading for big trouble and very few Americans realize it. Not only will the peak and decline of U.S. shale oil and gas production spell disaster for the U.S. economy, it will also be one of the factors responsible for ending precious metals manipulation.
The only way the Fed and Central Banks can continue propping up their fiat currencies is with massive monetary printing and bond purchases. While this tactic keeps the system together, it does so by adding debt on top of more debt. This debt can only be settled by a growing economy.
Unfortunately, the world is currently experiencing a plateau in global oil production. Without continued growth of the world’s oil supply, the massive government debt (which backs the global fiat currencies) becomes a real nightmare.
Furthermore, when the world’s oil supply finally starts to decline, global GDP growth will turn south right along with it. Which means, the Fed and Central Banks will lose the ability to control the huge debt-based fiat currency system.
Thus, precious metal manipulation ends by default.
The Increase In U.S. Shale Energy Decline Rates Spells Big Trouble Ahead
As the MSM continues to call for U.S. Energy Independence (even though the IEA recently released a new report now forecasting a decline of North American Oil Supply), the situation in the country’s shale energy industry takes a step for the worse as decline rates increase in a big way.
Since I wrote my article, The Coming Bust Of The Great Bakken Oil Field, the decline rates at the Bakken, Eagle Ford and Marcellus increased substantially.
When the EIA – U.S. Energy Information Agency released their November, 2013 Productivity Report, the forecasted decline rate for the Bakken field in the month of December was 63,000 barrels per day (bd). Each month, the EIA puts out a new report showing how much new production and the legacy decline rate from each shale oil and gas field.
Well…. let’s say, they report most of the fields. The EIA omits the Barnett shale gas field data because its peak and decline doesn’t paint a pretty picture for the rest of the bunch.
The Bakken’s decline rate increased from a 63,000 bd in December, 2013 to an estimated 72,000 bd in July:

Basically, the term “legacy oil production change”, means the decline of oil production from existing wells. This is estimated on a monthly basis and shown in “barrels per day.” So, the Bakken is now forecasted to lose 72,000 barrels per day from its existing oil wells in July, up from 63,000 in December, 2013.
This is a 14% increase in the decline rate in just seven months. If you think that’s high, take a look at how bad the situation is at the Eagle Ford shale oil field in Texas.

While the Bakken’s decline rate increased 9,000 bd in seven months, the Eagle Ford jumped up a staggering 31,000 bd (83,000 bd to 114,000 bd). Thus, the Eagle Ford decline rate increased nearly three times as much as the Bakken at 37% during the same time period.
So how do these decline rates impact new monthly production? If we take a look at the next chart, we can see that the Bakken’s legacy decline rate increased from 71% of new production in Dec, 2013 to an estimated 78% in July.
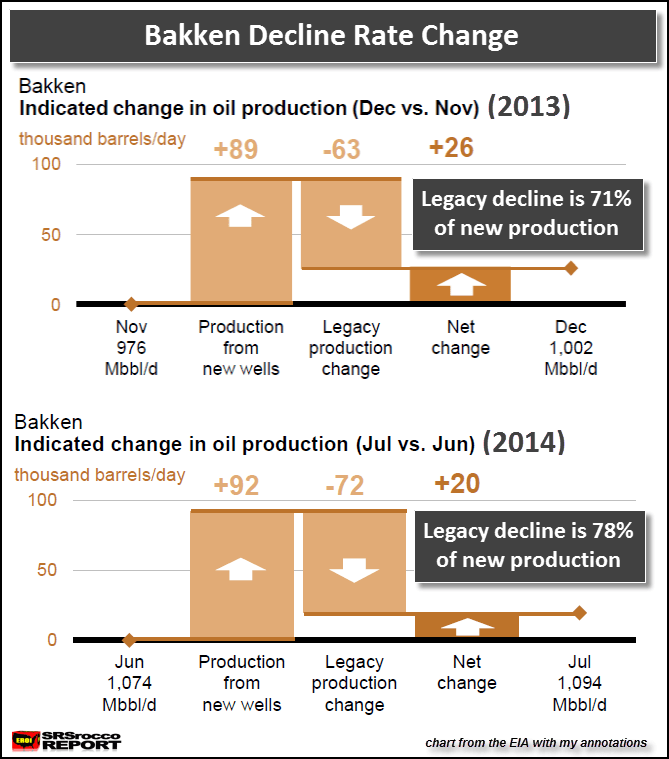
When the Bakken produced 89,000 bd of new production in Dec, 2013, the 63,000 bd decline rate was 71% of this total. The EIA estimates the decline rate in July at 72,000 bd, which is now 78% of the 92,000 bd of new production.
We must remember, as the decline rate continues to increase each month, the companies drilling in the Bakken have to ramp up production even more, or the field will peak and decline.
This is the trouble the energy companies are faced with drilling in the Eagle Ford. In just seven months, the legacy decline rate at the Eagle Ford increased from 71% in Dec, 2013 to a forecasted 83% in July.
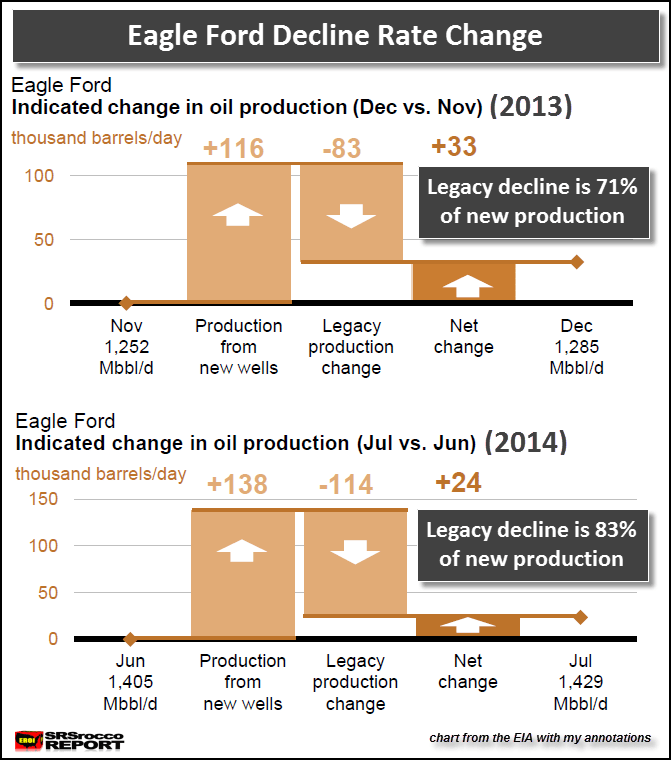
What a difference… aye? In Dec, 2013 the Eagle Ford only had to add 83,000 bd of new production to remain flat, however they now need to add 114,000 bd to keep production from declining.
At some point, the decline rate will edge closer to that 100% mark, which means the field will peak and decline shortly after.
The Decline Rate At The Mighty Marcellus Shale Gas Field Nearly Doubles
If it wasn’t for the Mighty Marcellus shale gas field, overall natural gas production in the United States would be declining. Looking at the data during the same time period (Dec 2013- Jul 2014), the Marcellus decline rate shot up from 31% to 58%… in just a mere seven months.
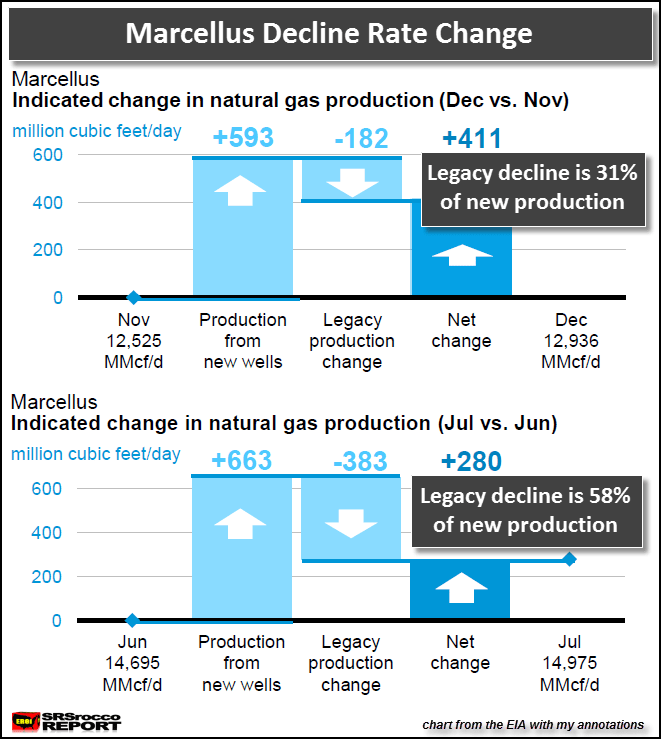
Back in Dec 2013, the Marcellus added 593 (mcf) million cubic feet per day of new natural gas production and suffered a decline rate from existing wells of 182 mcf with a net change of 411 mcf per day. This was a large amount of net new production at a 31% monthly decline rate.
However, in just a little more than half a year, the Marcellus legacy change (decline rate) is forecasted to increase to 383 mcf or 58% of new production (663 mcf), providing a net addition of 280 mcf per day for the month of July. Actually the decline rate more than doubled if we just consider the change from 182 mcf to 383 mcf.
While there’s a lot of natural gas in the Marcellus, it will peak and decline at some point. Furthermore, very few energy companies are making money producing shale gas at the current market price of $4.50.
And then we have this article by the Guardian, U.S. Shale Boom Is Over, Energy Revolution Needed To Avert Blackouts:
Global energy watchdog confirms ‘the party’s over’ – lowers US production projections, demands urgent investment
But the IEA’s latest assessment has proved the detractors right all along. The agency’s World Energy Investment Outlook released this week says that US tight oil production – which draws largely from the Bakken in North Dakota and the Eagle Ford in Texas – will peak around 2020 before declining.
The new analysis puts an end to the ‘100 year supply‘ myth widely promulgated by industry, and moves closer to the more sceptical assessment of a US tight oil peak within this decade.
Now IEA chief economist Fatih Birol says:
“In Europe we are facing the risk of the lights going off. This is not a joke.”
We need $48 trillion of new investment to keep the lights on – and it’s far from clear that investing in increasingly expensive unconventional oil and gas is going to cut it, without serious impacts on the global economy.
Several of the energy analysts that I pay attention to (Bill Powers, David Hughes & Art Berman) believe the peak of the Bakken and Eagle Ford may occur sooner than 2020…. possibly within the next year or two. It really depends on the price of a barrel of oil.
If the U.S. and global economies fall into a bad recession-depression in the next few years, the price of oil will more than likely decline significantly. This will destroy the ability for the shale oil and gas companies (as well as the other high cost unconventional oil sources) to continue drilling. Once drilling stops, production falls off a cliff.
In addition, the major oil companies are already cutting back on CAPEX spending as well as selling assets to remain profitable. The major oil companies now realize that increasing production is impossible as the oil price is not high enough to justify the added expense.
Basically, the world cannot afford expensive oil… which means the major oil companies cannot increase investment. Without the needed investment, peak oil comes sooner than later
Peak Oil Will Destroy Precious Metal Manipulation By Default
The precious metal community receives a lot of heat from analysts on the subject of gold and silver manipulation. For example, Trader Dan Norcini doesn’t believe the gold and silver market is manipulated… especially over a long period of time.
While Trader Dan and many of his fellow bloggers on his site poke fun at the precious metal bugs who believe in gold and silver manipulation, the truth is…. it doesn’t really matter at all.
You see the biggest flaw in Trader Dan as well as many other analysts who believe that the markets ARE NOT RIGGED, is that they fail to understand the global energy situation. As I have stated many times, the value of most STOCKS, BONDS and PAPER ASSETS are derived from a growing economy, which is based on a growing energy supply.
As the global oil supply peaks and declines, the value of most paper assets will decline. The only way to protect wealth at this time will be in physical assets such as GOLD & SILVER. It was the SIPHONING of investor funds into paper assets such as derivatives, options, stocks and bonds that caused the REAL MANIPULATION of the precious metals market.
TLB recommends you visit SRSrocco Report for more great articles and pertinent information.
Peak Oil will destroy gold and silver manipulation by DEFAULT.


Leave a Reply