


First off, it is great to see that Germany will lift ALL C19 restrictions shortly.
Piece by Eugyppius describes it here:
(100) The German pandemic ends as scheduled; nothing will ever be the same (eugyppius.com)
Secondly, it is also good to see that the US TSA will remove all entry restrictions to the US on May 11th – to align with its southern “open border “policy.
The need to impose ANY restrictions for ANY reason is falling away. Pity the WHO is so behind the times that it has NOT lifted its classification of a Public Health Emergency of International Concern (PHEIC, pronounced FAKE).
Note that once the US signs the amendments to the International Health Regulations and/or any Pandemic Treaty, it will not be able to lift any restrictions or terminate any injection programs/non-pharmaceutical interventions (NPI’s) unless the WHO says so.
The BMJ applauded with more than a golf clap here:
WHO keeps covid-19 a public health emergency of international concern | The BMJ
Check out India’s take here:
With COVID-19 cases soaring a quick look at the revised guidelines – Oneindia News
Ok, with that said, let’s return to the lethality of the Giant Syringe in the Room.
Here’s a backdrop for the discussion. It boils down to can the number of people killed by the C19 injections be approximated by answering one or both of these questions:
“what is the URF?”
“what is the number of deaths per million doses?”
To be answered for each of the major countries/regions of the US, EU, India and China.
DO NOT FORGET THAT THE ENTIRE PREMISE FOR LOCKDOWNS< MASKING, SOCIAL DISTANCING ETC WAS PREDICATED ON A DISCREDITED, WILDY INACCURATE AND FALSE DATA MODEL PROVIDED BY PROFESSOR NEIL FERGISON OF IMPERIAL COLLEGE THAT REMAINS ON THE INTERNET HERE:
One (of a multitude) article debunking the shoddy modelling is here (with an embedded link to the Excel file by country):
The Failure of Imperial College Modeling Is Far Worse than We Knew | AIER
So, one shoddy model to create a global panic with ZERO peer review compared to lots of censorship of those trying to work out answers via debate and testing hypothesis.
I provided “ball-park” calculations for the number killed by the injections way back in August 2022 when I was triggered by WHO claims of 20 million lives saved by injections.
(100) 20 million saved or 20 million killed – by Peter Halligan (substack.com)
Followed up by this comparing the different methods to estimate the Under-Reporting Factor in the US and EU:
Followed up by this on 1 January 2023:
Let’s focus just on the US. The Europeans, Indians and Chinese make up almost 40% of global injections worldwide (around 5 billion out of 13 billion doses administered). The US under 700 million. Anecdotal evidence of the Under-Reporting Factor is 70 for Europe. India has no proper robust records and the Chinese keep theirs secret.(I doubt the Chinese would be backward in coming forward about the relative safety and effectiveness of their “traditional” vaccine if it was markedly superior to that of the US and EU).
The inestimable Norman Fenton and Martin Neil – who I have dubbed the “Michelangelo’s of Maths” produced this piece a few days ago. A minimal assumption methodology that arrives at a URF of around 8 – which is one fifth my initial presumption of 40 – and results in far lower estimates of death,
(100) How many deaths were caused by the covid vaccines? (substack.com)
Skidmore produced another method in a pre-print that has been retracted and is discussed here:
(100) Skidmore article on Covid vaccine uptake and injuries retracted (substack.com)
There is enough data in all those references to provide more than a semblance of informed debate.
I want to approach this from a top-down perspective as well as the bottom-up methodology.
That is, how do we reconcile the chart below to the numbers killed by the SARS-COV2 virus progressing to the C19 disease and extra deaths for the calendar years 2020, 2021 and 2022.
Here is the chart from here:
United States Deaths in 2022, How Many Deaths in United States 2022 | Dead or Kicking
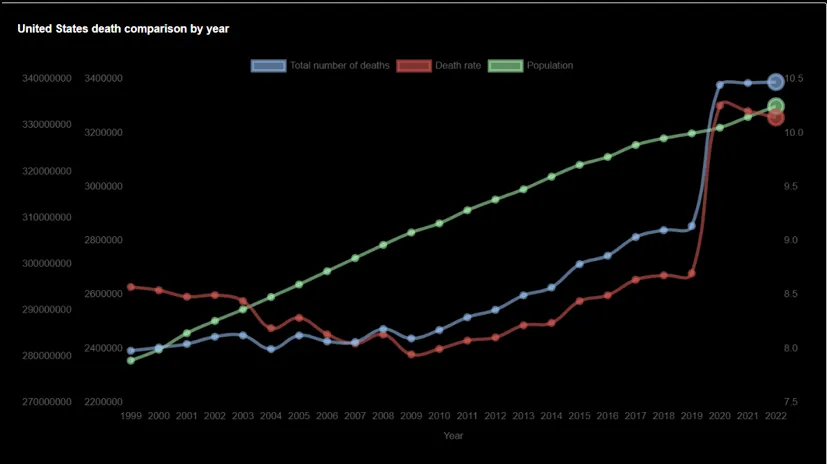
The red line is the rate pf deaths and the light blue line is the total number of deaths. The green line is population.
What is immediately apparent is that there has been a pronounced upward shift in deaths since C19 emerged and it has not dropped back to pre-C19 levels.
I have produced this table in the past – it is a combination of data from the CDC and USAMortality.com
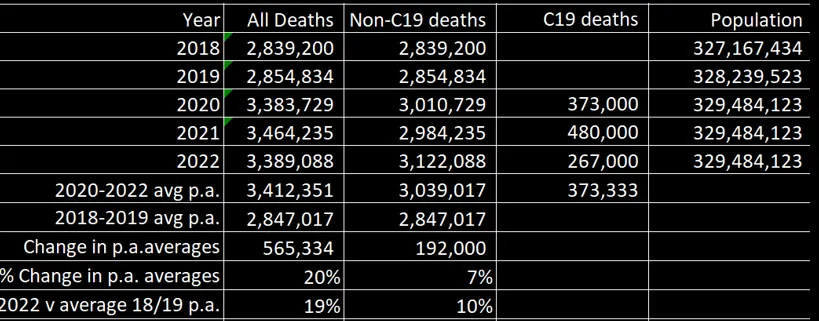
This is the place to start to reconcile the numbers for C19 deaths and injection deaths.
What caused the 565,000 extra deaths over EACH calendar year of 2020, 2021 and 2022?
Let’s just throw a few other (dumbfounding) factors out there:
1. As per WHO instructions, all deaths with C19 present, using a flawed and withdrawn Drosten RT-PCR test within 28 days must be shown as C19 deaths. That includes those “vaccinated” that died from the injections.
2. Estimates are that, as opposed to a “case rate”, more than 90% of Americans have been infected with SARS-COV2 and had been in 2021. It follows that 90% of deaths could have been ascribed to C19.
3. The average age of those defined as “deaths with C19 present” has been 2-3 years older than average life expectancy. 95% of those succumbing had 2-6 co-morbidities already killing them. Life years lost has not been performed by anyone for any demographic – either because of C19 or the injections.
4. Clinical trials of tens of thousands of people who were released to the general population during those trials, infected people with variants forced by the injections. Are those “vaccine deaths”? Was the milder Omicron variant also a “forced” variant? We do not have data on whether those that died were injected once, twice or more – neither do we have data on VAERS on whether those reported dead from vaccines, were previously infected with C19.
5. We now know that the infection fatality rate of the general population is the same as the ‘flu.
6. The ‘flu disappeared over the entirety of 2020 and 2021.
7. The number of people that died because, for example, medics not wanting to be infected, slammed the door in their patients faces, or because medics prescribed Remdesivir, or denied existing treatments such as antibiotics.
I will leave aside the intentional falsification of VAERS data using a technique called “throttling” highlighted here:
(100) VAERS Guinness World Throttling Record! Today 3/31/2023 (substack.com)
So, now that you have reached this far, what is my “conspiracy hypothesis”?
Ball-parking a need to reconcile an extra 530,000 deaths for each of 2020, 2021 and 2022:
For 2020 – the new flu (SARS-COV2) replaced the old flu and killed around 50,000 Americans out of the extra 530,000 deaths in 2020. Around ¾ of the remainder of 530,00 – call it 400,000 – died because of NPI’s (non-pharmaceutical interventions), denial of medications, Government imposition of the removal of the will to live and the remainder because of the use of Remdesivir – 130,000 dead from “run death is near”.
For 2021 – the roll-out of the injections – 528 million over the calendar year, 339 million by 30 June 2021, call it a time weighted average of around 400 million for the year, use a rule of thumb of one death per thousand doses to get 400,000 deaths from the injections for 2021. Another 50,000 “new flu” deaths”, maybe 30,000 from NPI’s and a further 30,000 slaughtered by Remdesivir treatment protocols.
For 2022, the number of injections dropped markedly to around 138 million, but, there is now a number of deaths from the injections in 2021. NPI’s had largely been lifted, Remdesivir use had largely stopped, the “new flu” remained at normal old flu levels of 50,000 leaving only the cumulative impact of injections. 480,000 dead from injections over 2022.
Number of US injections taken from here:
Coronavirus (COVID-19) Vaccinations – Our World in Data
That would add up to 880,000 injection deaths. Given the number of deaths reported to VAERS is 17,315 (after the “throttling”) this would mean a URF of around 51. Which is still way under the URF of >100 of the Lazarus Report.
Now, these factors are all “variables” that can be permutated in all sorts of ways. The factors can be confounding or dumbfounding.
What we do know is that US “causes of death” are a complete fiction – meaning that the US prefers that health policy is misaligned with outcome improvements across any of the leading causes. In other words, each “leading cause” of death does NOT reflect actual numbers which have, instead, been labelled “C19” – in error, as per instructions by the WHO to use a test not intended for diagnosis.
Onwards!
Please upgrade to paid, or donate a coffee (I drink a lot of coffee) – “God Bless You!” if you can’t or don’t want to contribute. Coffee donations here: https://ko-fi.com/peterhalligan

••••
The Liberty Beacon Project is now expanding at a near exponential rate, and for this we are grateful and excited! But we must also be practical. For 7 years we have not asked for any donations, and have built this project with our own funds as we grew. We are now experiencing ever increasing growing pains due to the large number of websites and projects we represent. So we have just installed donation buttons on our websites and ask that you consider this when you visit them. Nothing is too small. We thank you for all your support and your considerations … (TLB)
••••
Comment Policy: As a privately owned web site, we reserve the right to remove comments that contain spam, advertising, vulgarity, threats of violence, racism, or personal/abusive attacks on other users. This also applies to trolling, the use of more than one alias, or just intentional mischief. Enforcement of this policy is at the discretion of this websites administrators. Repeat offenders may be blocked or permanently banned without prior warning.
••••
Disclaimer: TLB websites contain copyrighted material the use of which has not always been specifically authorized by the copyright owner. We are making such material available to our readers under the provisions of “fair use” in an effort to advance a better understanding of political, health, economic and social issues. The material on this site is distributed without profit to those who have expressed a prior interest in receiving it for research and educational purposes. If you wish to use copyrighted material for purposes other than “fair use” you must request permission from the copyright owner.
••••
Disclaimer: The information and opinions shared are for informational purposes only including, but not limited to, text, graphics, images and other material are not intended as medical advice or instruction. Nothing mentioned is intended to be a substitute for professional medical advice, diagnosis or treatment.


Leave a Reply