


Written by Lance Roberts | Dec, 10, 2016
- Review & Thoughts On “Dow 20,000”
- This Looks A Lot Like 1999
- Last One Out Turns Off The Lights
- Sector Analysis
- 401k Plan Manager
Review & Dow 20,000
This past week, the market advanced 3% heading towards my target of 2400. The Dow broke above 19700 and is within striking distance of the “psychological” summit of 20,000.

With just 250 points to go, it is extremely likely traders will try and push stocks to that level by Christmas. Woo Hoo!
Caveat Emptor!
Before you go printing up your “Dow 20,000” hats, there is a dark side to the advance.
If you go outside and throw a ball into the air, it will travel until the momentum of the ball is overtaken by gravity. There is, just for a very brief moment, a point where the ball is stationary. However, eventually, gravity wins.
The same is true for market prices. As I discussed on Friday:
“The importance of understanding the nature of reversions is critical for investors. Markets rarely move in one direction for very long, notwithstanding overall trends, without a correction process along the way. While the chart below shows this clearly for the overall market, it applies to individual sectors of the market as well.”

“Importantly, notice the bottom two part of the chart above. When there is a simultaneous culmination of overbought conditions combined with a more extreme deviation, corrections usually occur back to the underlying trend.
This can also be seen in the next chart as well. While the ‘Trump Rally’ has pushed asset prices higher and triggered a corresponding ‘buy signal,’ that signal has been triggered at very high levels combined with a very overbought condition. Historically, rallies following such a combination have not been extremely fruitful.”

While the “exuberance” of the Trump rally has certainly awakened the “animal spirits,” the sustainability of the advance from such egregiously overbought conditions is questionable. David Rosenberg weighed in on this point via The Globe & Mail:
“Okay, so the president-elect is now at 3 percent, again skewed by two or three sectors. Big deal. Ronald Reagan, who was the original ‘Make America Great Again’ advocate (as opposed to a copycat), saw the equity market soar 6 percent in his first month in office.
Guess what? The market peaked less than four weeks into his term and for the next two years we had an economic downturn and a 25-percent slide in the stock market. The combination of rising bond yields, Fed tightening and a stronger dollar took care of that honeymoon.
After all, we all know what happens when the honeymoon is over. The hard work begins.
That slump we just saw in October export volumes and widening in the trade deficit is surely just an early sign of what is to come.
Before The Donald does anything on his first hundred days, something tells me the lagged impact of the tightening in financial conditions associated with the recent bounce in interest rates and appreciation of the U.S. dollar is going to come back and bite the economy in the tush, as was the case heading into 2016.”
It’s Beginning To Look A Lot Like…1999!
It is interesting to watch the excitement build around the market once again as we head into the New Year. There is an optimism rising the “new bull market” has finally arrived and we are set to start an unprecedented advance as the calendar turns. Take a look:
- Dow 20,000 And Beyond – Mark DeCambre
- 3-Reasons The Trump Rally Will Continue – Stephen Gandel
- Reasons Why Stocks Are In “Melt-Up” Mode – Adam Shell
- Rising Rates Good For Stocks – Lee Jackson
- Rising Yields Signal Economic Growth – Peter Ireland
- Rising Yields A Bullish Signal – James Picerno
You get the idea. And, as I showed last weekend, investor confidence is extremely high levels as well. But here is the latest from NAAIM which shows managers at a net 101% exposure.

See, it’s all good….for now.
If this market rally seems eerily familiar, it’s because it is. If fact, the backdrop of the rally reminds me much of what was happening in 1999.
1999
- Fed was hiking rates as worries about inflationary pressures were present.
- Economic growth was improving
- Interest and inflation were rising
- Earnings were rising through the use of “new metrics,” share buybacks and an M&A spree. (Who can forget the market greats of Enron, Worldcom & Global Crossing)
- Stock market was beginning to go parabolic as exuberance exploded in a “can’t lose market.”
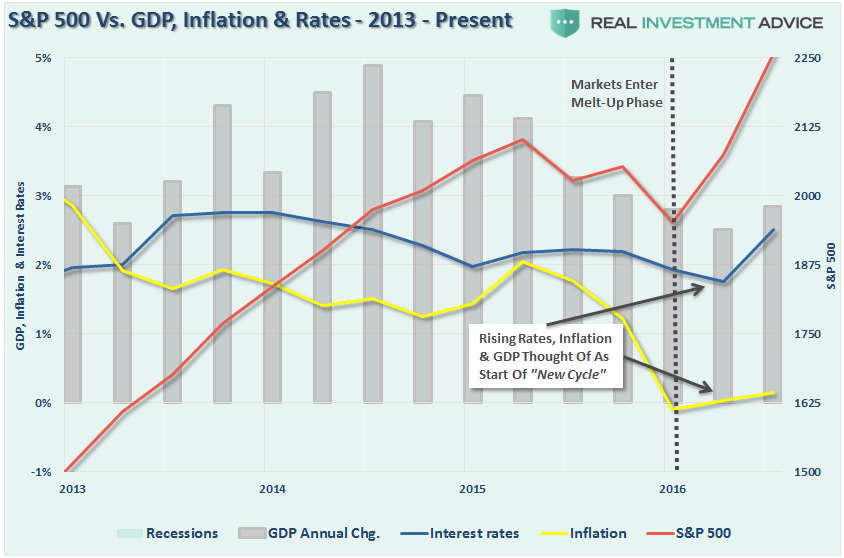
If you were around then, you will remember. The charts below show a comparison of GDP, Inflation, Interest Rates (10-year) and the S&P 500 between 1998-2002 (dashed lines) and 2014-Present (solid lines). The data is nominal and quarterly.
While inflation rates and GDP growth are substantially weaker than in 1998, the recent turn higher is similar to what we saw during that previous period. Notice in 2000, there was a spike higher in GDP which got the bulls all excited just before the recession took hold.

The same is true for interest rates which rose about 1.5% between 1998 and 2000. Rates then resumed their long-term downtrend in conjunction with the onset of a recession.

Of course, as rates, inflation, and economic growth were rising by small amounts, investors pushed assets prices higher expecting the longest economic growth cycle on record to continue for another decade.

It didn’t.
The last chart gives a better comparison. I have combined interest rates, GDP, and inflation into a single “economic index” for both the 5-year period beginning in 1998 and 2014 to present. I then recalibrated the 2014 index and market to 1998 levels.
This is where it gets interesting. If you look at the chart you would quickly make the argument that we have 8-10 quarters ahead of us before a problem occurs. However, because we are running at HALF of the previous rate, there is substantially less room to fall before a recession sets in. In other words, in 1998, the economy had to decline from a 7.5% growth rate to hit recessionary levels.

Considering we are at 2% today, the time to recession will be considerably shorter – like 2-4 quarters kind of short.
For the skeptics, here is the actual data graphed from 1997-2014. Stocks entered the melt-up phase as the “Bullish Mantra” changed from:
Lower rates and lower inflation is good for stocks
To:
Higher rates and higher inflation is good for stocks

The mantra of higher inflation and higher rates is good for stocks has once again returned as stocks enter their “melt-up” phase of the advance. As shown above, it wasn’t the case then and it likely won’t be the case now.
While there is much hope the new President, and his newly minted cabinet, will “Make America Great Again,” there can be a huge difference between expectations and reality. And, like in 1999, there is just the simple realization that eventually excesses will mean revert.
Last One Out, Turns Off The Lights
I know, lot’s of charts, but “bear” with me. (pun intended)
As shown below, the market is currently pushing well into 3-standard deviations above the 50-day moving average. As discussed above, such extensions are rare and do not historically last very long.

As shown at the top of the next chart, the market is currently at 92% of a full 3-standard deviation extreme. The horizontal dashed red line shows all the previous times the market hit such extreme levels going back to 1992. Short and intermediate-term corrections are common along with more major crashes.

This last chart shows a longer-term picture of quarterly data back to 1942. With valuations high and the markets extremely overbought, as shown by the vertical red dashed lines, corrections have been common. The highlighted areas show where extreme deviations have collided with really bad outcomes….like now.

Here is the point. Despite the rampant optimism running through “Main Street” and “Wall Street” since the election there is little changed economically speaking. The economy remains weak, labor costs have surged, monetary policy has tightened, and a stronger dollar negatively impacts corporate earnings. Wages haven’t increased much for the average worker and employment is still trending lower.
In fact looking at the primary indicators of things that affect the production side of the economic equation, things don’t look so good.

However, the markets rally on expectations. Therefore, here is the question you must answer:
“After a 200% increase from the financial crisis lows, trillions of dollars injected into the financial markets and the economy, and 8-years of economic growth – exactly what is not already priced into the financial markets?”
Valuations are also a problem (both P/E and Tobin Q-ratios) with investors currently on the wrong side of the equation.

For those long energy-related equities, this is likely a good time to take in profits and rebalance exposure during short-term corrections.
However, the bigger picture is that while long-exposure remains recommended currently, it is also critically important not become overly complacent. Just because the lights are still on and the music “still a pumpin’”, smarter investors tend to quietly exit before the cops show up.
Just don’t forget to turn off the lights if you are the last to leave.
Market & Sector Analysis
Data Analysis Of The Market & Sectors For Traders
S&P 500 Tear Sheet
Thank you for your recent suggestions, while not all requests are possible to fulfill due to data limitations, I do appreciate the input. We are working on adding some momentum indicators to the tear sheet. If you have any suggestions or additions you would like to see, send me an email.

Sector Analysis
Comments
While the markets seemed to rally broadly last week, such was really not the case when we looking at individual areas. Financials continued to lead the charge the last week, and are extremely overbought. Profit taking is highly recommended. Small and Mid-cap stocks, Energy (on oil cut deal from OPEC) and Industrials outperformed the index as well. The problem, as stated above, is that a stronger dollar and higher interest rates will likely hamper this optimism sooner rather than later. This is particularly the case with Small and Mid-Cap companies that are the most susceptible to monetary tightening.
(Note: I have changed the sector and major market analysis charts to a 50/200 DMA crossover signal and embedded an overbought/sold indicator.)


The table below shows thoughts on specific actions related to the current market environment. (These are not recommendations, just ideas related to market extremes and contrarian positioning within portfolios. Use at your own risk and peril.)

The table below shows the relative performance of each sector as compared to the S&P 500 over a 1, 4, 12, 24 and 52-week basis. Historically speaking, sectors that are leading the markets higher continue to do so in the short-term and vice-versa. The relative improvement or weakness of each sector relative to index over time can show where money is flowing into and out of. Normally, these performance changes signal a change that lasts several weeks.
(Note: The buy/sell signal at the far right is a binary result based on the crossover of the short and long-term moving averages and is not a specific recommendation.)
The numbers of sectors on SELL signals is INCREASING despite the market melt-up suggesting a much narrower overall advance than major indices would suggest. This is typical of a late-stage melt-up rally so caution is advised.
Utilities, REIT’s, Staples, Bonds, Gold, and Healthcare have remained under pressure this past week. While Basic Materials, Financials, Industrials and Energy are beginning to push extremes.
Importantly, notice the cluster of assets that are grossly underperforming the S&P 500 currently. THIS DOES NOT LAST LONG and tends to historically lead to rather swift reversions in the trade. Everything is currently pointing to this being the case so profit taking and rebalancing is strongly advised.
THE REAL 401k PLAN MANAGER
The Real 401k Plan Manager – A Conservative Strategy For Long-Term Investors

There are 4-steps to allocation changes based on 25% reduction increments. As noted in the chart above a 100% allocation level is equal to 60% stocks. I never advocate being 100% out of the market as it is far too difficult to reverse course when the market changes from a negative to a positive trend. Emotions keep us from taking the correct action.

Pushing Extremes
From last week:
“As discussed over the last couple of weeks, the markets not only reversed the breakdown, and rallied to new highs, as expected previously, investor confidence has exploded since the election.
That’s the good news.
However, this rally is likely done for the moment and we need to wait for a bit of rebalancing before increasing target exposures heading into the new year.”
I was clearly wrong on the second point as the market continued to rally this past week, but, as discussed in the main body of this week’s newsletter, it is a narrow advance and reminiscent of previous market melt-ups.
I continue to suggest using the current rally to clean up portfolios as detailed in November 4th missive. Here are the important points.
Step 1) Clean Up Your Portfolio
- Tighten up stop-loss levels to current support levels for each position.
- Hedge portfolios against major market declines.
- Take profits in positions that have been big winners
- Sell laggards and losers
- Raise cash and rebalance portfolios to target weightings.
Step 2) Compare Your Portfolio Allocation To The Model Allocation.
- Determine areas requiring new or increased exposure.
- Determine how many shares need to be purchased to fill allocation requirements.
- Determine cash requirements to make purchases.
- Re-examine portfolio to rebalance and raise sufficient cash for requirements.
- Determine entry price levels for each new position.
- Determine “stop loss” levels for each position.
- Determine “sell/profit taking” levels for each position.
(Note: the primary rule of investing that should NEVER be broken is: “Never invest money without knowing where you are going to sell if you are wrong, and if you are right.”)
Step 3) Have positions ready to execute accordingly given the proper market set up. In this case, we are looking for a rally which will reduce the short-term oversold condition of the market and allow for a better opportunity to reduce overall portfolio risk.
The big risk in the near-term is when the markets come to grips with the rise in rates, simultaneously with a stronger dollar, which will quickly erode earnings in an already over-valued market. IF the Fed hikes rates in December, we could well see another January swoon as we saw this year as much of the backdrop is still extremely weak.
If you need help after reading the alert; don’t hesitate to contact me.
Current 401-k Allocation Model
The 401k plan allocation plan below follows the K.I.S.S. principal. By keeping the allocation extremely simplified it allows for better control of the allocation and a closer tracking to the benchmark objective over time. (If you want to make it more complicated you can, however, statistics show that simply adding more funds does not increase performance to any great degree.)

401k Choice Matching List
The list below shows sample 401k plan funds for each major category. In reality, the majority of funds all track their indices fairly closely. Therefore, if you don’t see your exact fund listed, look for a fund that is similar in nature.

Lance Roberts

Lance Roberts is a Chief Portfolio Strategist/Economist for Clarity Financial. He is also the host of “The Lance Roberts Show” and Chief Editor of the “Real Investment Advice” website and author of “Real Investment Daily” blog and “Real Investment Report“. Follow Lance on Facebook, Twitter and Linked-In


Leave a Reply